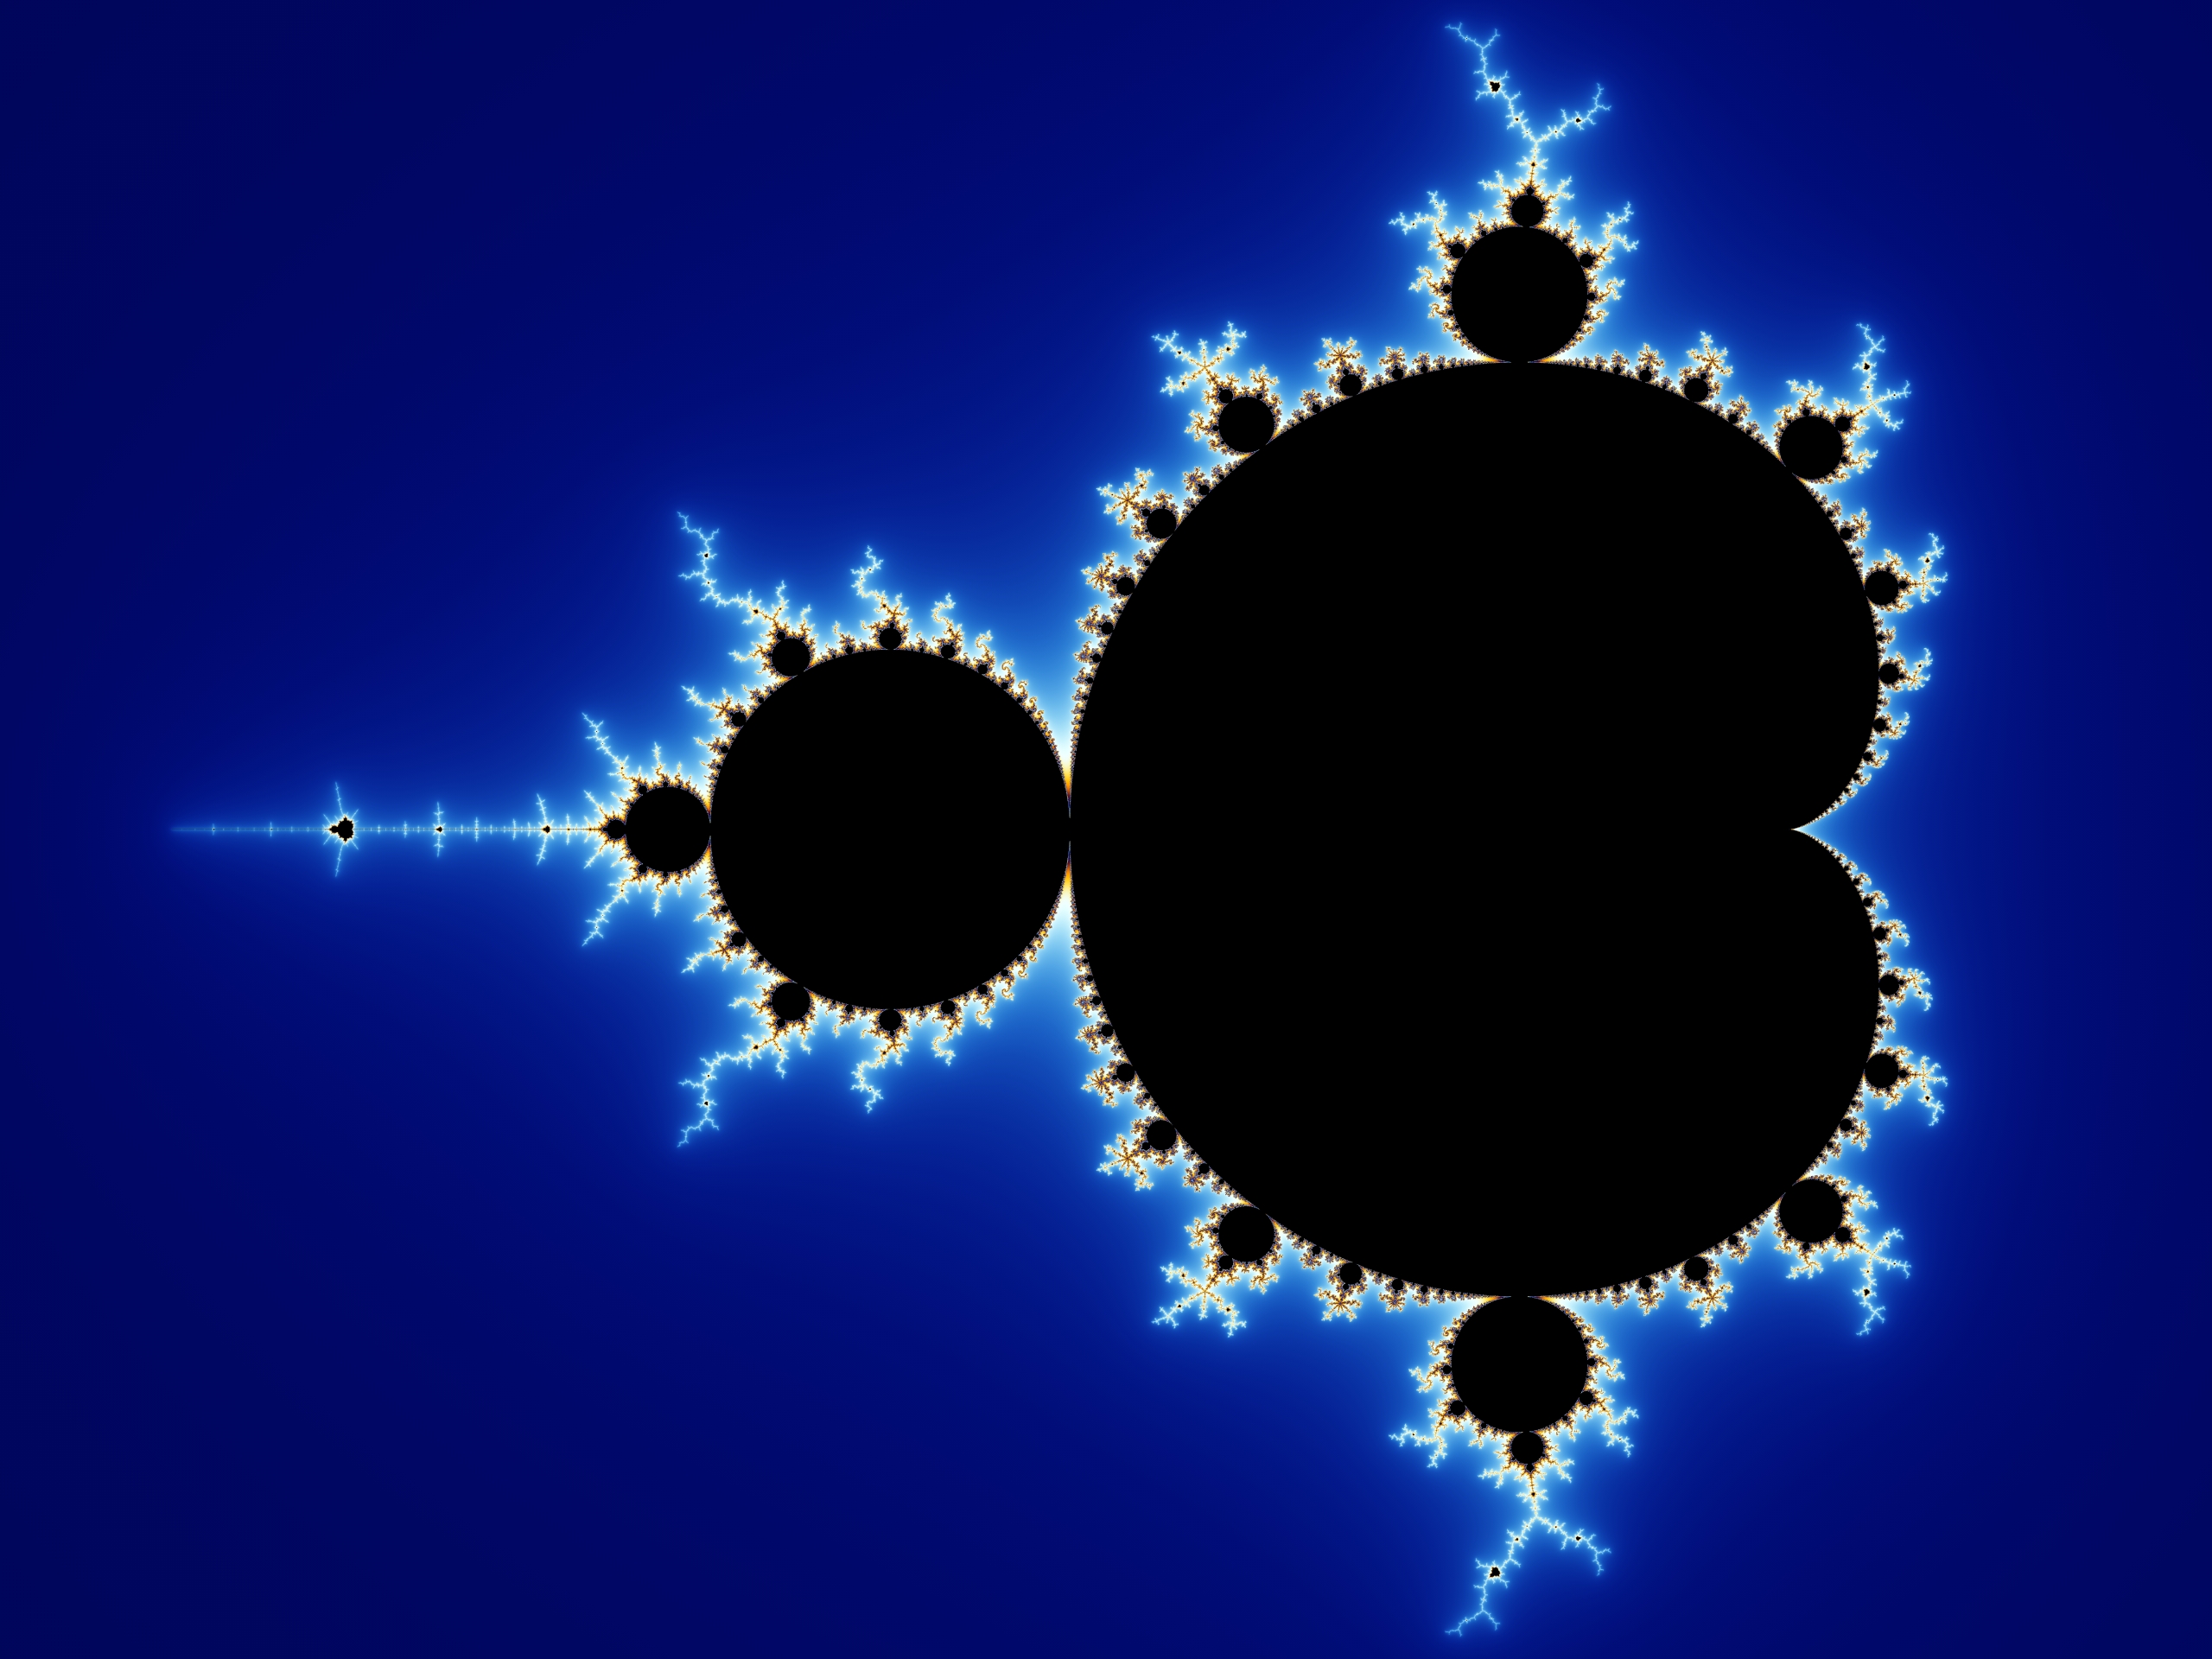
In mathematics, one of the most beautiful visual representations in my opinion is Mendelbrot set. To appreciate its beauty, one doesn't have to be a mathematician or from a similar background. However I think it is better to understand how we achieve this fractal pattern because it will show us that this pattern is not something human-made, but is a natural phenomenon. Next paragraph will explain the mathematics behind this set.
Firstly we will set our iterative function and set an initial real number.Our iterative function is as
follows:
What was most significant about the lunar voyage was not that man set foot on the Moon but that they set eye on the earth.
Let's say we chose 2 and the iterative values are:
1st: 6
2nd: 38
3rd: 1446
4th: 2090918
......
This value gets really big as we iterate on and on again, this means the value diverges over time. However the strange thing happens when we pick any value between -2 and 0.25 (inclusive), to show that let's say we pick 0.21 as an initial c value:
1st: 0.2541
2nd: 0.27456681
3rd: 0.2853869331535761
4th: 0.2914457016148037
5th: 0.2949405969897452
...
As you can tell by this example, this iteration is stabilizing around 0.29 and nearly never change around a significant iteration later. In mathematics this is called converging. This interval of numbers that are converging is called Mandelbrot set.
This can be shown in a simple graph:
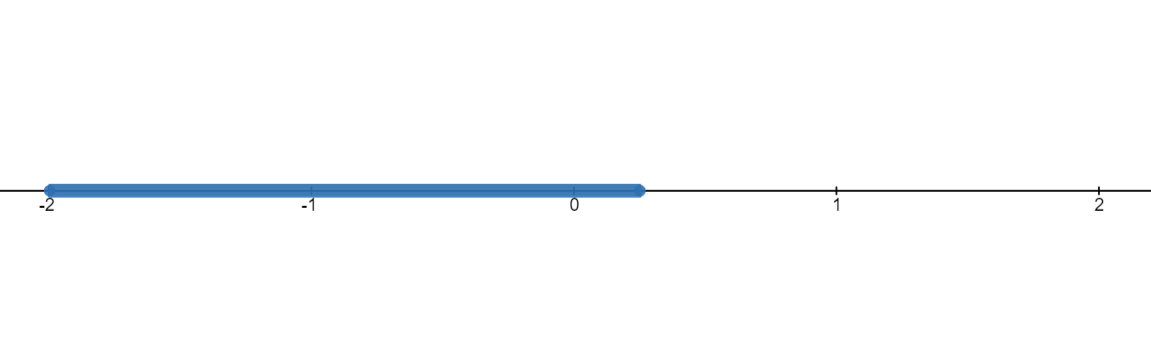
As you can see there is nothing too interesting about that graph. However, when we add another dimension to this graph in the form of complex numbers, the graph will have the following shape where the behaviour of the iteration can be bounded which means the value will stay within a distance from the point zero but will not converge, it can converge or can diverge.
Here is the example code:
Java
public static void main(String[] args) {
double number =0.21;
double init =number;
int i=0;
while(i<8) {
i++;
number = number* number +init;
System.out.println(number);
}
}
Source section
- Mandelbrot set. from Wolfram MathWorld. (n.d.). Retrieved March 21, 2023, from https://mathworld.wolfram.com/MandelbrotSet.html
- Devaney, R. (1970, November 24). What is the Mandelbrot set? Plus Maths. Retrieved March 21, 2023, from https://plus.maths.org/content/what-mandelbrot-set
- Fractal geometry. IBM100 - Fractal Geometry. (n.d.). Retrieved March 21, 2023, from https://www.ibm.com/ibm/history/ibm100/us/en/icons/fractal/